Products & Technologies
Back to Menu
Products & Technologies
Services
Resources
TABLE OF CONTENTS
A Letter from Ali Salehpour - Climb the Productivity Curve Faster
Leveraging the Digital Twin in Smart Microelectronics Manufacturing
STMicroelectronics Demonstrates Adaptive Endpoint Control System for 200mm CMP
Applied Materials Technology-Enabled Services Support Next-Generation Manufacturing
Maximize Output from Fleets of Tools
Industry 4.0 Reaches into the Subfab
The Last Word: Smart Transportation to Drive Semiconductor Content
Maxmize Output from Fleets of Tools
By Haim Albalak and Chris Keith
Given today’s high market demand for semiconductor products, device manufacturers are looking for ways to maximize the output of good wafers from their fabs−and optimize their returns on invested capital.
One key opportunity is to increase the output of potential bottleneck tool groups (fleets) within a fab. Capacity-planning studies for medium-to-large fabs show that almost any tool group can become a bottleneck and limit a fab’s potential output.
Customers frequently engage the Applied Materials FabVantage™ Consulting group to help them find ways to squeeze more capacity from their existing fabs. Now a new capability from this group, Applied FabOptimizer,™ is available to help customers boost the output of their Applied Materials tool fleets, deferring the need for sizeable capital investments.
TAKING A BROADER VIEW
Optimizing fab output requires a broad, comprehensive analysis of all potential output improvement opportunities, not just examination of one or two elements. Often, semiconductor manufacturers focus on improving one type of output loss, such as equipment uptime, but our experience shows that the overall value to the fab is much higher when the focus is on improving all relevant losses in the aggregate.
The SEMI E79 standard can help manufacturers understand the different types of equipment capacity loss. It defines metrics and calculations for measuring equipment productivity and capacity, including overall equipment efficiency (OEE).
The loss-types that SEMI E79 defines are availability loss, operational loss, rate loss, and quality loss (figure 1). All of these should be minimized or eliminated to maximize fleet output.
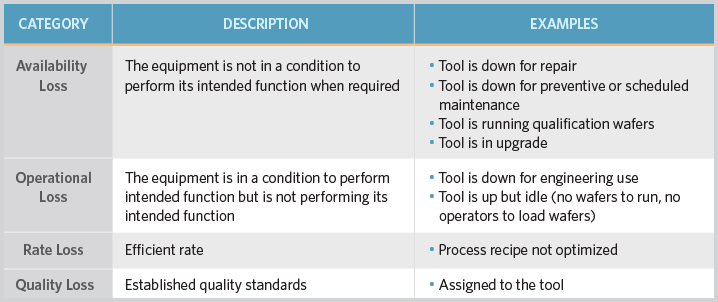
Figure 1. SEMI E79 OEE efficiency loss categories
In addition to reducing or eliminating OEE losses, it is vital to reduce the variability in uptime among all the like tools to increase a fleet’s total output and reduce disruptions to the fab WIP flow. Fortunately, the availability of vastly more equipment and process data, along with more powerful computing resources and analytical methods, and a continually growing knowledge base, now make it possible to effectively reduce uptime variability.
Doing so is important not just in regard to bottlenecks but for most tool fleets in the fab. In general, uptime variability may lead to increased cycle times, missed production due dates, WIP bubbles moving in the fab, and a reduction in OEE.
Figure 2 shows that when a fleet’s uptime variability is reduced, more output can be produced in the same cycle time, or alternatively the same level of output can be produced more quickly.
COMPREHENSIVE FLEET OUTPUT OPTIMIZATION
Applied FabOptimizer assessments comprehensively analyze the performance of customers’ Applied Materials tools using a powerful, structured methodology and specialized software tools. The focus is on identifying sources of tool OEE loss and on developing recommendations to improve wafer outs. The analysis and recommendations address all areas of OEE loss, including tool and chamber downtime, idle time, rate loss and quality issues.
FabOptimizer shifts the focus from individual factors that affect output to relationships among variables by providing rapid data integration and analysis for very large data sets.
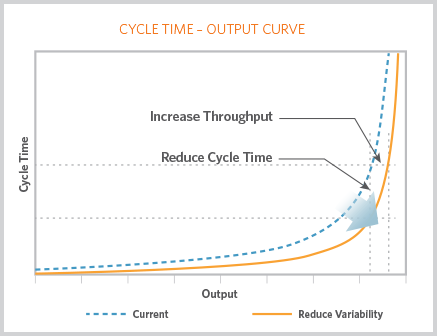
Figure 2. Reducing the variability of uptime in a fleet of tools gives manufacturers the ability to either increase output while maintaining the same cycle times, or shorten cycle times for the same level of output.
It is a unique combination of techniques and tools that, by extracting and transforming customer data, can offer a holistic view of OEE losses and variability across a fleet of like tools.
It also leverages the strengths and capabilities of Applied’s subject matter experts in process and equipment, and combines their expertise with state-of-the-art simulation and data analysis tools, and industrial engineering techniques. FabOptimizer assessments use powerful software for big data analysis and tool simulation, incorporate Applied’s extensive knowledge base of best practices and best known methods (BKMs) for unit process and maintenance, and have access to a comprehensive benchmark database.
Key components of FabOptimizer engagements are shown in figure 3. They include the following tools and services.
- Fleet Analyze: Applied’s automated big data analysis tool is used by FabVantage consultants to compile large data sets from multiple sources, e.g. Manufacturing Execution System (MES) database, maintenance management system, tool event logs and trace files. They then apply multivariate models and algorithms using the Fleet Analyze tool. This identifies and quantifies output improvement opportunities in areas such as white space reduction, tool dedication, recipe optimization, PM scheduling, dispatching and scheduling.
- Applied ToolSim™: Applied’s graphic simulator for throughput analysis. Tool and event logs are used to develop and calibrate the simulation model. After validation, tool experts can use the model to quickly run many “what-if” simulations to identify and quantify opportunities for throughput improvement.
- Recipe Optimization: Performed by Applied unit process experts to identify gaps in our BKMs for process and cleaning recipes, this analysis highlights differences that affect tool throughput (wafers per hour or wph) and process capability.
- Tool Emulator: This is a software that replicates tools using a laptop. The configurations of the virtual tools exactly match those of the actual tools in the fab, including the software version they use. It enables FabVantage consultants to perform hours of experiments and validation on their laptops so that production does not have to be interrupted until the final stages of the project.
- Preventive Maintenance: Applied tool experts compare customer procedures, practices, and parts to Applied BKMs to understand how the tools are maintained and identify opportunities to reduce downtime and improve tool health.
- Tool Audit: This comprehensive and systematic audit of hardware and software by Applied subject matter experts identifies configurations, setups and settings that are limiting tool performance.
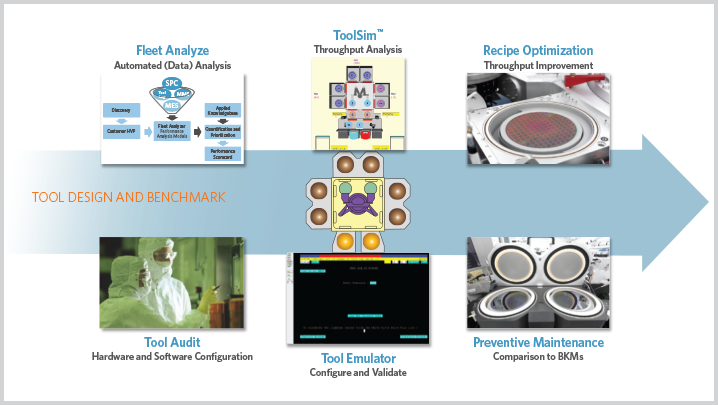
Figure 3. Applied’s FabOptimizer solution includes hardware and software components to enable FabVantage consultants to perform extensive multivariate data analyses, run simulations to find ways to increase output, and compare maintenance activities with best practices.
DEMONSTRATED RESULTS
FabOptimizer engagements have been performed on fleets of Applied Materials equipment in fabs around the globe, each demonstrating significant improvements in customer output and return on capital investment. Here are a few examples.
Endura® PVD Tools: Increase Throughput
A customer wanted to transfer some of their Endura tools to another fab. Removing the tools would have reduced the capacity of the fleet below the current level of fab wafer starts, resulting in a significant decrease in wafers out of the fab.
In order to maintain the current wafer starts, the customer asked Applied Materials to find ways to increase the throughput (wph) of the remaining tools without affecting unit process quality levels.
Using the FabOptimizer methodology, a number of opportunities for throughput improvement were identified. ToolSim was used to develop simulation models of the tool to evaluate the impact of different settings and recipes times on throughput.
Figure 4 shows the results of the throughput sensitivity analysis for different combinations of robot logic settings, robot speed, and bottleneck chamber recipe time. An additional benefit of the proposed changes to the robot logic settings was decreased variation of the bottleneck chamber idle time (figure 5). This improved unit process capability as the application was sensitive to temperature variations caused by wafers sitting idle in the transfer chambers.
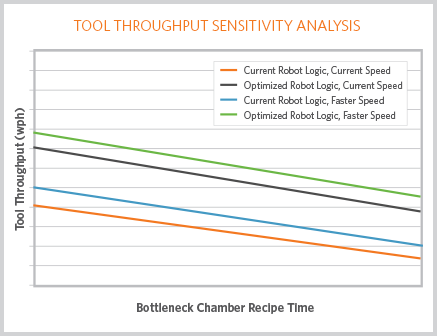
Figure 4. ToolSim sensitivity analysis showing the impact of bottleneck chamber recipe time and robot logic settings on tool throughput.
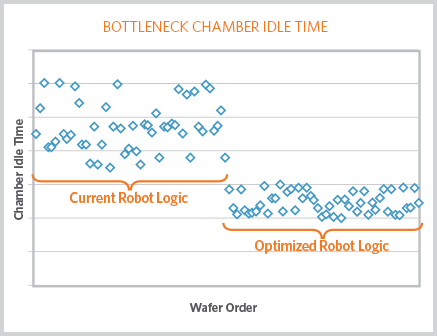
Figure 5. Robot logic optimization reduced both the amount and variability of bottleneck chamber idle time.
Based on the ToolSim results and inputs from Applied experts, a small number of changes were selected for additional evaluation using the Tool Emulator. Testing on the virtual tools increased confidence that implementing these changes on the actual tools would result in the expected improvement and saved more than 50 hours of time on the tools in the fab.
The total expected output improvement from the low-risk recommendations was more than 10% (figure 6). Eventually, the customer implemented all of Applied’s recommendations, including several of the higher-risk actions, and reported an actual output increase of more than 18%.
APPLIED SINGLE-WAFER VIISTA® IMPLANTERS: INCREASE OUTPUT
Applied FabOptimizer was used to achieve almost 10% output improvement for a customer’s fleet of Applied VIISta medium-current implant tools. Fleet Analyze revealed several potential issues limiting output from the fleet. A major one was that tools were spending 18 to 37% of total time performing recipe tuning (figure 7). When the tool is tuning the recipe, it cannot implant wafers so this time is lost output.
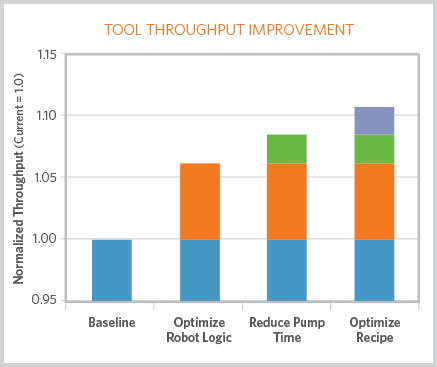
Figure 6. Roadmap showing more than 10% throughput improvement.
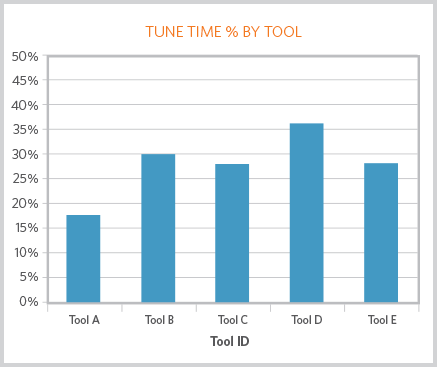
Figure 7. Comparison of percentage (%) tune time by tool showing that most tools run in tune state more than 25% of the time.
The high percentage of time needed for recipe tuning was mostly due to two factors. First, as figure 8 shows, 70% of the time after a lot was run, the next lot used a different recipe that required setup and tuning. Second, when there are no lots available that can run using the same recipe, the choice of which recipe to switch to can have a major impact on the time required to tune it. Figure 9 shows a matrix of tune times based on the current recipe running on the tool (the rows) and the tune time required to set up the next recipe (the columns) for one tool. Note that the values of the tune time in the table have been normalized, but represent the typical amount of variation observed.
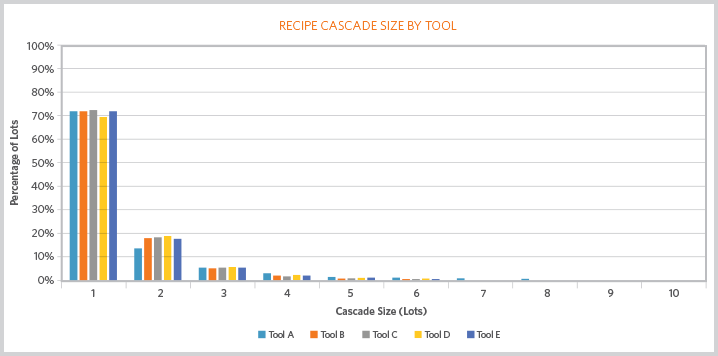
Figure 8. Recipe cascade size by tool showing that 70% of recipe cascades are only one lot.
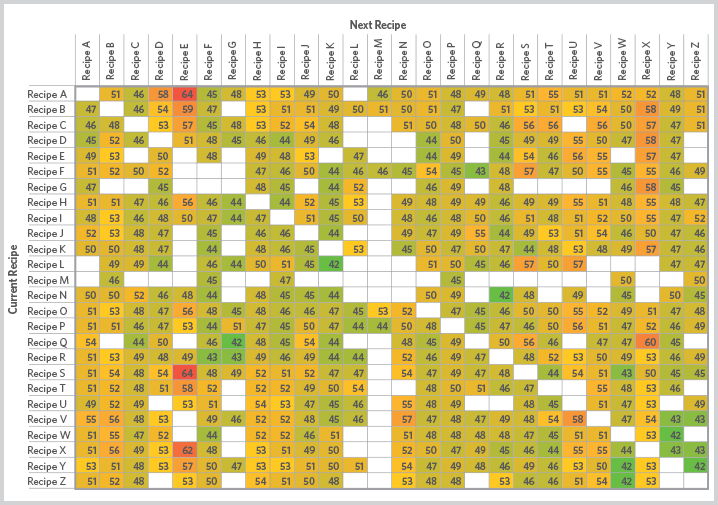
Figure 9. Matrix showing expected tune time based on current recipe and next recipe.
Based on these findings, Applied recommended that the customer use expected tune time as a key factor for selecting which lot to run next on each tool. This required updates to the customer’s current dispatching and scheduling algorithms in order to include tune time as a criterion. After applying the updated lot-dispatching algorithms to historical data, the expected level of output improvement from reduced tune time was estimated to be more than 5%. Subsequent implementation of the recommendations resulted in a significant drop in the percentage of total time spent tuning recipes.
EPI TOOLS BOTTLENECK EASED
Epi tools were the one of the top bottlenecks in a customer’s fab. The customer engaged Applied to identify opportunities and develop strategies to reduce bottlenecks and improve OEE.
Using the FabOptimizer methodology and technology, Applied consultants analyzed a few months of historical data including tool logs, equipment state logs and the lot transaction history. They found substantial opportunities for improvement. Unscheduled downtime and uptime variability were largely driven by issues with epi chamber process and hardware. Also, load-lock pump and vent times were not matched across the fleet.
The FabVantage consultants developed a roadmap of changes to address these issues and then implemented them. As a result of better tool matching, white space reduction and decreased unplanned downtime, the customer achieved a 15% increase in OEE (figures 10, 11 and 12).
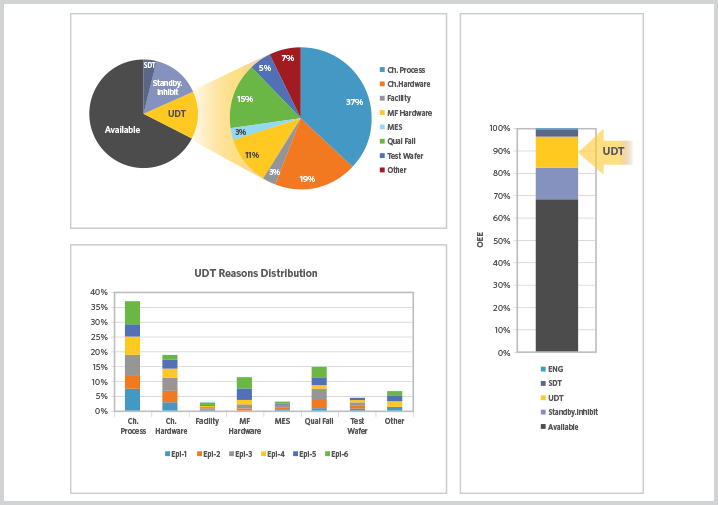
Figure 10. Uptime analysis of epi fleet.
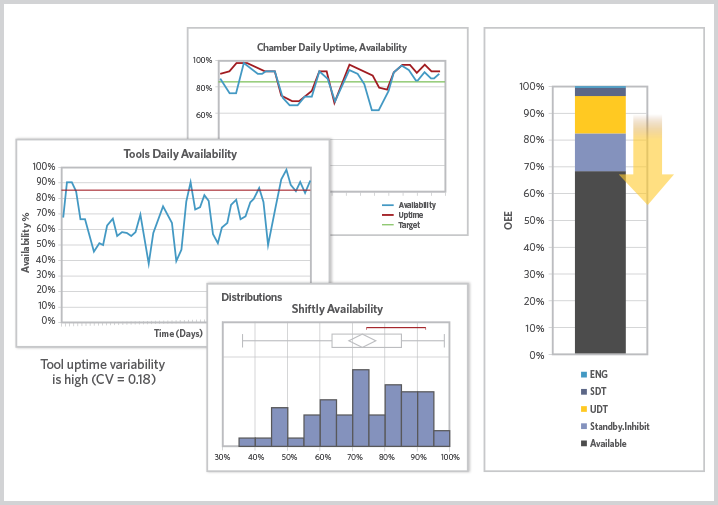
Figure 11. Uptime variability analysis of epi fleet.
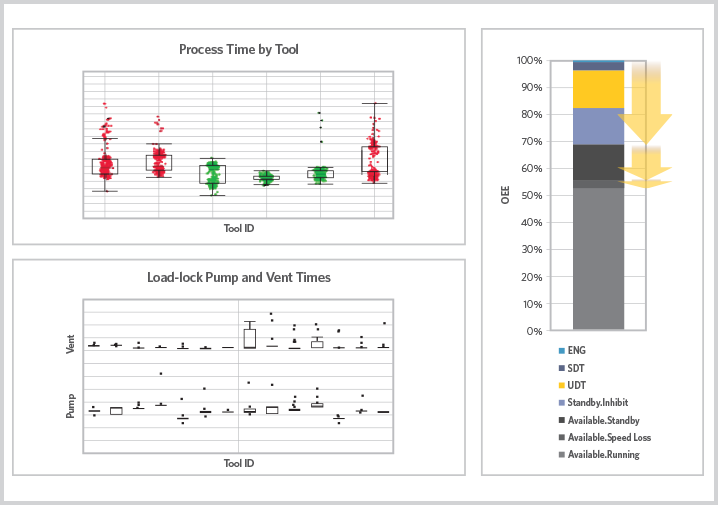
Figure 12. Loss analysis of epi fleet speed.
CONCLUSION
Chip demand is reaching record highs, supply of some new tools is constrained, and the pace of new technology ramps is increasing. As device makers strive to increase the output of their existing fabs in this environment, fleet optimization is a compelling and economical way for them to obtain a holistic view of their tool performance, increase their output and take advantage of today’s market opportunities.
For additional information, contact haim_albalak@amat.com.
