Products & Technologies

Products & Services
Company
Contact
Back to Menu
Products & Services
Products & Technologies
Services
Resources
Company
Contact
TAKING FACTORY QUALITY TO THE NEXT LEVEL
By Selim Nahas

Applied Materials is developing a quality improvement strategy that combines quality data in a cohesive and automated manner and maps the results into a Failure Mode and Effects Analysis (FMEA) system that provides users with recommended actions.
Given the growth and evolution of factory automation systems, most fabs now find themselves with a vast amount of production data that is not well understood, prioritized, or integrated. Consequently, the data is largely unused for decision-making.
This lack of integration has led to two fundamental problems when it comes to improving product quality. First, visibility into quality remains a manual exercise. Second, the data cannot be used in real-time decision-making to reduce defects.
To overcome these issues, Applied Materials is proposing a strategy that aligns key manufacturing principles that are typically not well-streamlined. Detection is at the heart of this strategy, closely tied to the methods of continuous improvement and risk management. In addition, an archiving strategy that allows for rapid and accurate auditability for compliance purposes is also proposed.
In the intensely competitive semiconductor industry, minimizing production costs is critical. Scrap is a significant contributor to the cost of goods sold (COGS). Reducing COGS and achieving zero defects in device manufacturing are major priorities, so a new approach to factory data that uses end-to-end quality principles is essential. The ability to quickly and accurately identify non-conforming work-in-process (WIP) is also key to reducing it, and to enabling faster and more effective decision-making (figure 1).
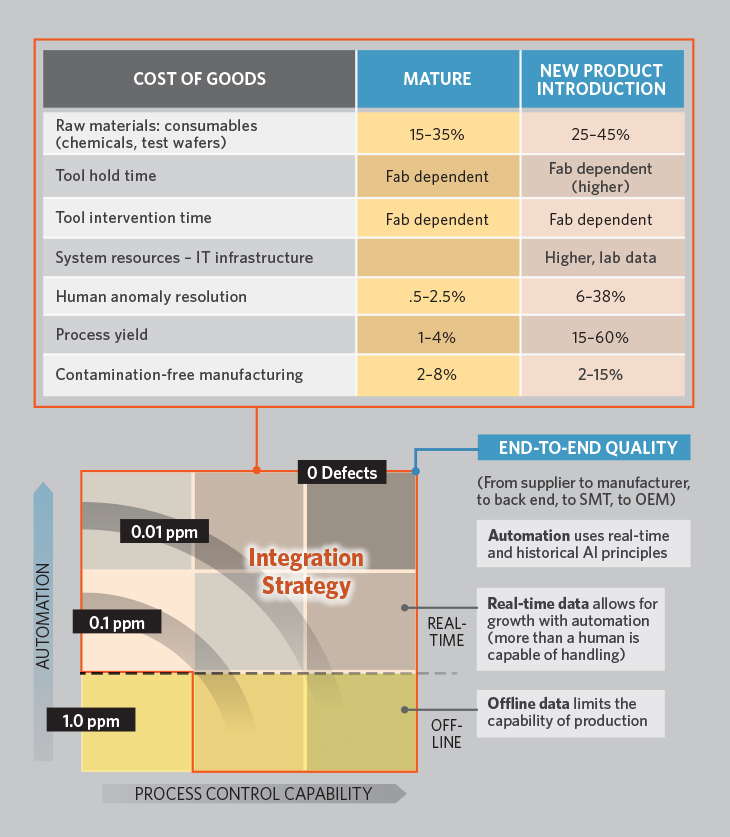
Figure 1. The chart at the top shows the impact new product introduction has on COGS. Moving from 1.0ppm— where most manufacturers perform today—to a zero-defect capability will require extensive automation and process control capabilities.
However, if you ask an automation professional how much data is actually used for decision-making, most will contend it is somewhere between 5–10%. In many cases, it is well understood that there is value to be derived from the data set—provided a certain structure and access speed can be obtained—but its sheer volume poses a fundamental challenge. That is because these systems have numerous moving parts that must work cohesively, using highspeed data in real time. Fundamentally, this means we must now look toward distributed architectures and new algorithms.
A VOICE FOR EVERY SIGNAL
Over the last six months, an Applied Materials team has been developing the Applied SmartFactory® Automated Anomaly Handling platform. This expert system interprets existing wafer data in real time to enable a greater degree of anomaly detection. The intention is to give a voice to every signal, in the form of a decision that ultimately leads to an action. This structured approach will serve as the basis for enabling future factory systems to use artificial intelligence/machine learning (AI/ML) principles.
The Applied team’s work uses the fact that most computer-integrated manufacturing (CIM) solutions typically show thousands of signals in the form of error codes and messages. However, these are often ignored because (1) they have no landing point, (2) they are often ambiguous, and (3) their full implications were not considered in the fundamental design.
A well-designed system considers the interdependencies of signals and measures within a manufacturing environment, allowing users to correlate signals effectively. By correlating such data, users can focus on the elements that truly matter to quality.
Because a fab may maintain somewhere between 30,000 and 150,000 statistical process control (SPC) charts and can easily have more than a million fault detection charts, any strategy that reduces the number of charts required while retaining or raising the expected quality would be valuable. This is more easily said than done, however, and requires advanced expert system principles.
CUSTOMERS DEMAND HIGHER QUALITY
The need for higher quality is driven by increasingly stringent customer requirements. The automotive sector, for example, is the fastest growing one with an estimated compound annual growth rate (CAGR) of 9–11% over the next two years. The number of semiconductor devices used in vehicles has tripled over the past five years, and about 22% of automotive warranty returns are now electronic in nature. All this growth has brought about a quantum change in quality requirements, because semiconductors make possible the advanced features automakers are seeking for their customers.
In addition, fabricating automotive devices often requires new materials and extensive documentation because these devices will be operating in harsh environmental conditions over many years (figure 2).
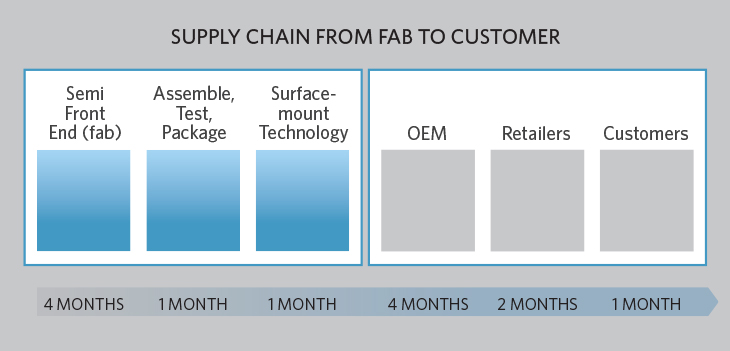
Figure 2. An effective archiving strategy is required to help audit future field returns that can occur two years later in automotive and other applications.
For example, approximately 80% of devices for automotive uses are manufactured on a 200mm line or below, and new materials such as silicon carbide (SiC) are increasingly favored. However, SiC wafers are not available in 300mm sizes, and often not in 200mm, so these heightened quality challenges are falling upon fabs with older generations of equipment and systems.
CORRELATING WAFER MEASUREMENTS WITH SENSOR TRACES
Defining a system that correlates wafer measurements against sensor trace data (e.g., virtual metrology) requires emphasizing the timing and structure of this relationship. Applied Materials is pursuing numerous activities to profile these principles with the intention of applying predictive maintenance (PdM) principles and augmenting sampling strategies.
The Applied team is developing an approach to structure, integrate, and interpret data coming from wafer measurements with the goal of achieving higher quality. This requires defining each measurement to align with its respective recipe. It also means systems will no longer look at individual process steps in a discrete fashion but rather will interpret multiple process steps as the singular interdependent relationship of various manufacturing attributes. As a result, we will no longer decide based on a single chart, but instead evaluate all the process steps that led to the current measurement and their contribution(s) to variance.
This project emerged from the expertise Applied Materials has gained by building process and equipment FMEAs, where it became clear that the number of variables required for high-quality decision-making exceeds the capacity of human cognitive ability. In addition, certain analytic real-time techniques can be applied to look for patterns in the data coming from FDC and SPC and map them to something humans can use as input to automate actions.
UNIFYING STATISTICAL PROCESS CONTROL AND FAULT DETECTION
First, we must define a relationship to establish cause and effect. This must be closely followed by introducing variability-reduction capabilities to raise the quality of the data set used for correlation. The primary requirement is predicated on three fundamental principles: (1) The critical sensor parameters of interest must be identified to reference against the inline measurement. (2) the decision to use these sensor results in either a UVA or MVA format. (3) the real-time comparison of UVA, MVA and inline SPC data in an automated manner will provide visibility into enhanced detection. For example, figure 3 shows the results of an inline SPC chart with data analyzed at the site level along with the traditional mean and EWMA statistics. The blue and red points represent failures at the site level that failed a proprietary statistical test of variance within the data set from the traditional SPC measurements. Comparing these results to UVA and MVA charts will be more meaningful than a traditional summary statistic. Figure 4 shows variability by site on a set of wafer samples. These results are mapped against a physical coordinate system to look for meaning in the pattern.
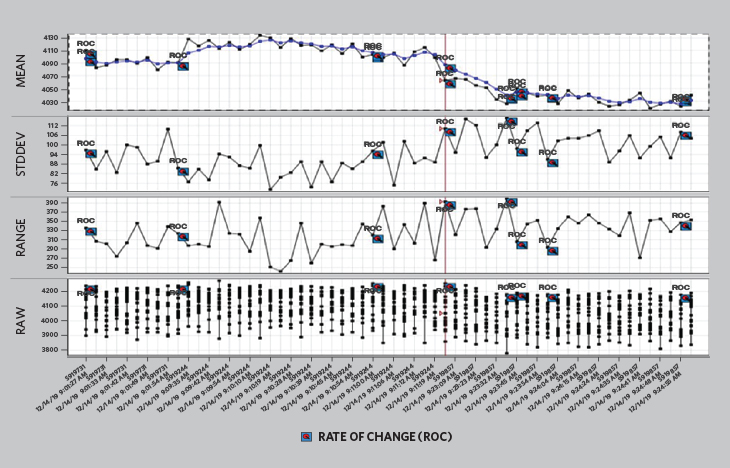
Figure 3. This SPC chart shows the results of data analyzed at the site level that failed a statistical test of variation. The blue squares represent failed rate of change.
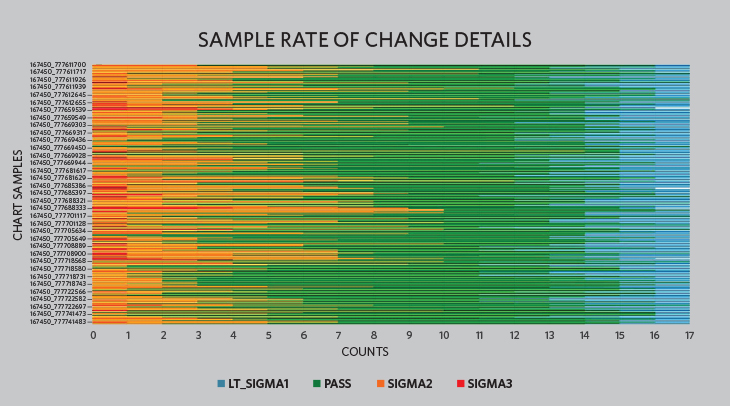
Figure 4. This sample shows 17 site measurements. The red color indicates the sites that are imposing excessive variation into the measurement statistic.
The data must be transformed to be correlated, because while SPC and fault detection and classification (FDC) systems offer a reasonable way to detect deviations, they offer little insight into the root cause of variation. Measured anomalies and pattern mapping will provide more effective insight into the source of failures. A diversion of results between SPC sites and FDC results is a granular indication that something has changed. The delta is also charted in SPC to be used for detection. In the event that a inline measurement is not available due to sampling, we can rely to some degree on the FDC results.
SYMPTOMS WITHIN THE DATA
There are common flaws in the ways SPC and FDC are typically run in a facility. For example, with an SPC chart comprising between 12 and 40 raw data sites, the pattern of variation by sight can be used to interpret root cause. While this is not a new concept, it has not made its way into most quality systems that review SPC data. Guiding principles that would enhance this capability are typically found in separate yield management systems (YMS) and defect management systems (DMS), which attempt to assign meaning to a wafer defect pattern to identify its sources.
With fault detection, meanwhile, we typically set limits to monitor alarms and understand how a system runs under nominal conditions for a given recipe. But variation within UVA limits is meaningful to the strategy of correlating sight measurements with sensor data. While the ability to assign a diagnosis in real time can be achieved using an automated system, a human would be hard-pressed to identify and mitigate risk to wafers quickly enough.
It must be acknowledged that setting boundaries on the data used to interpret limits and actions is always challenging. For example, equipment interventions, such as changing part types and vendors for equipment components, can result in variations. Also, different devices, having different topographies, tend to lend variations of their own for the same recipe. The secret is to discern the appropriate period of time and events and subset of sensors to monitor and understand the actual capabilities of the process for a given product and recipe. This must become an automated exercise or it will not scale to meet the fab’s broader needs. As stated earlier, it must be continuously validated against the SPC data using automation.
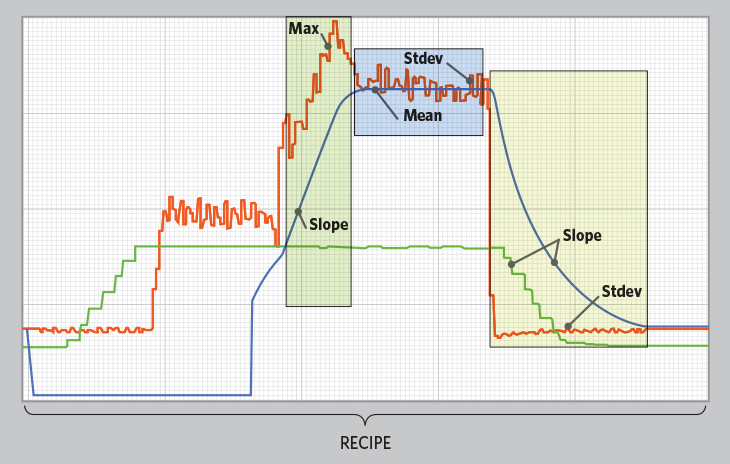
Figure 5. This recipe chart shows sensor trace data that an integrated system would continuously correlate to the SPC chart shown in figures 3 and 4.
IP SENSITIVITIES AND OTHER ISSUES
Technology that can be used to resolve these problems must be sensitive to information sharing (IP) issues. Fabs looking to apply machine learning and artificial intelligence automation capabilities across the enterprise will need to ensure that their vendor noncompete/nondisclosure agreements are not violated. This is necessary because a strategy combining inline SPC data with fault detection data inevitably must also consider incoming materials from competing vendors.
This has historically created numerous barriers to developing such systems. But to advance toward higher quality, we must accommodate privacy requirements while still providing relevant information to make the appropriate decisions on the fab floor. A use case for such a decision would be discerning whether measurement failure is a product of the current equipment set or the upstream equipment set.
One of the key challenges in a facility is information coming out of sequence. The sequence of manufacturing operations, versus measuring a wafer or a lot, has significance for data interpretation. An added challenge is the high-mix/low-volume problem often seen in our industry.
It can be very difficult to triage between product changes, preventive maintenance, chemical changes, and chamber-matching alone. So, if we are to identify with a high degree of certainty when equipment is abnormally drifting or experiencing a progressive failure, we will need to understand all these facets.
LOOKING TO NEW HORIZONS
Applied Materials is pursuing an initiative that combines SPC and FDC data in a cohesive and automated manner, then maps the results to an FMEA system to provide users with recommended actions. This initiative is the first step toward developing a future system that will enable AI in fabs. At present, the system can be considered an advanced expert system that addresses data structure and variability.
The path forward is becoming clearer and tests in manufacturing facilities are beginning to show promising results. Our next steps will be to gain more experience and eventually expand into other parts of the facility to include electrical tests.
For additional information, contact selim_nahas@amat.com

| Selim Nahas leads the Applied Automation Process Quality Group. |